Infrasense: SR-133 Concrete Pavement Evaluation

Infrasense, Inc. is a US-based subsurface scanning and analysis firm with decades of experience evaluating pavements, bridge decks, and transportation infrastructure across North America. Infrasense pairs non-destructive testing technology with engineering interpretation, giving road owners and their consultants a clear, data-driven picture of what lies beneath the surface — without closing a lane or cutting a core.

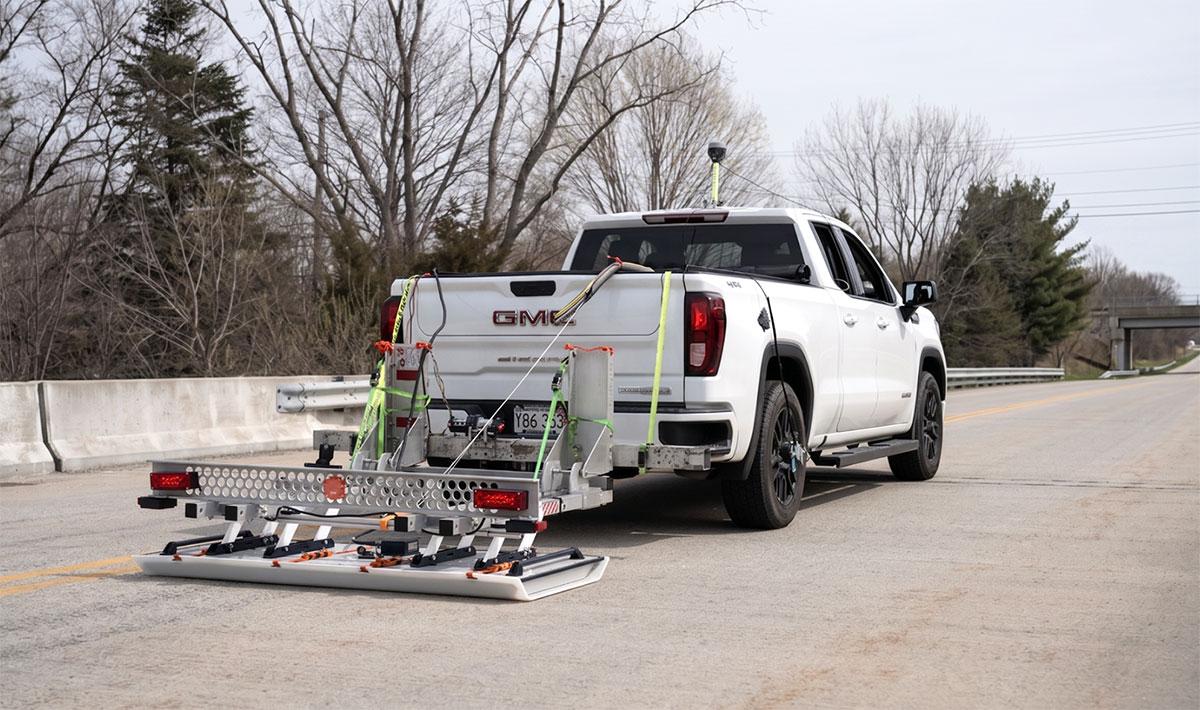
Infrasense on the road with a GROUND sensor

For the rehabilitation of State Route 133 in Lowell, Massachusetts, Infrasense used a Kontur 3D Ground Penetrating Radar (GPR) system and Kontur Examiner analysis software to map five subsurface conditions across the full 1.37-mile corridor — turning a century-old "patchwork" concrete road into a complete-coverage dataset its owner could budget against.

Project Overview

The Massachusetts Department of Transportation (MassDOT) and its engineering consultant, Howard Stein Hudson (HSH), needed to plan a concrete pavement restoration (CPR) program for SR-133 through Lowell's Belvidere neighborhood — an original concrete state route first built in 1929. Roads of this age are patched, partially reconstructed, and overlaid in pieces over decades. From above, SR-133 looks like one road; underneath, it is a patchwork of different pavement designs sitting side by side, lane by lane and segment by segment. That patchwork is the problem when a DOT has to decide how to spend its rehabilitation dollars. To allocate MassDOT Municipal Pavement Program funding with confidence, MassDOT and HSH needed answers over the full corridor — not at a handful of cores — to four questions: which concrete pavement design is in place at each location, whether the load-transfer hardware at the joints is sound, how thick the concrete is, and where voids are forming beneath the slab. Coring answers those questions at a few points. Full-coverage 3D-GPR answers them everywhere.Infrasense scanned the entire 1.37-mile corridor — 3.25 million square feet of pavement — with one survey pass per lane, non-destructively and at survey speed, while the road stayed open to traffic.

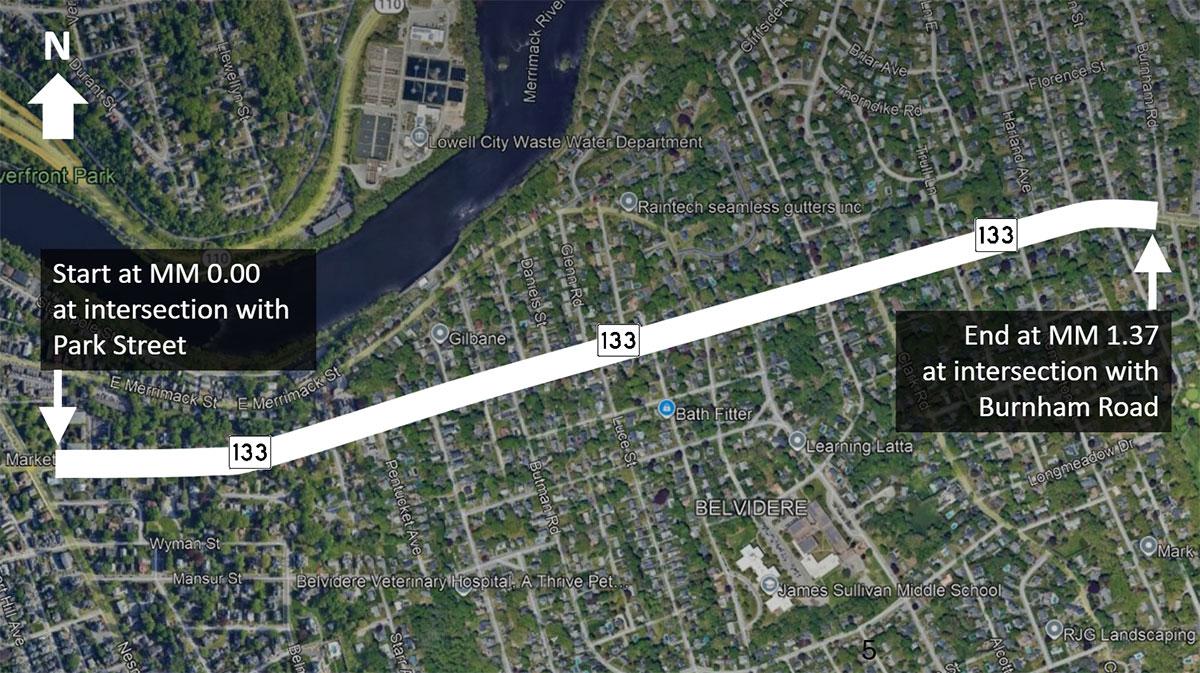
Locator map

Locator map: aerial view of the SR-133 corridor through Lowell, MA, with the project alignment marked from Park Street (MM 0.00) to Burnham Road (MM 1.37), Merrimack River and Belvidere neighborhood visible. Source: SR-133 KMZ, Google Earth corridor-overview screenshot.

Project Highlights:

  • 3.25 million square feet of concrete pavement surveyed across a continuous 1.37-mile corridor
  • Five subsurface conditions mapped — pavement design, dowels, tie bars, concrete thickness, and voids — in one survey pass per lane
  • No traffic disruption — non-destructive survey completed without lane closures or coring
End customer: Massachusetts Department of Transportation (MassDOT)
Engineering consultant: Howard Stein Hudson
Subsurface scanning & analysis: Infrasense, Inc.
Technology: Kontur 3D-GPR sensor · Kontur Examiner software

Methodology

Car with sensor details

Kontur 3D-GPR System

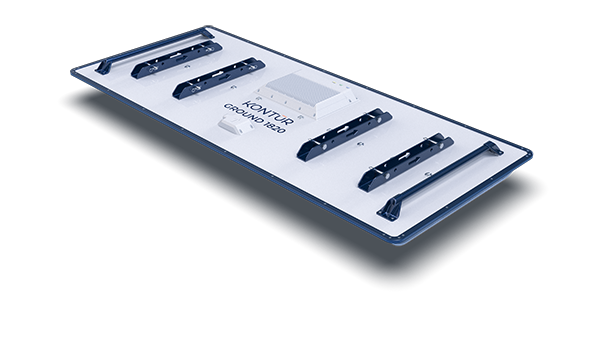
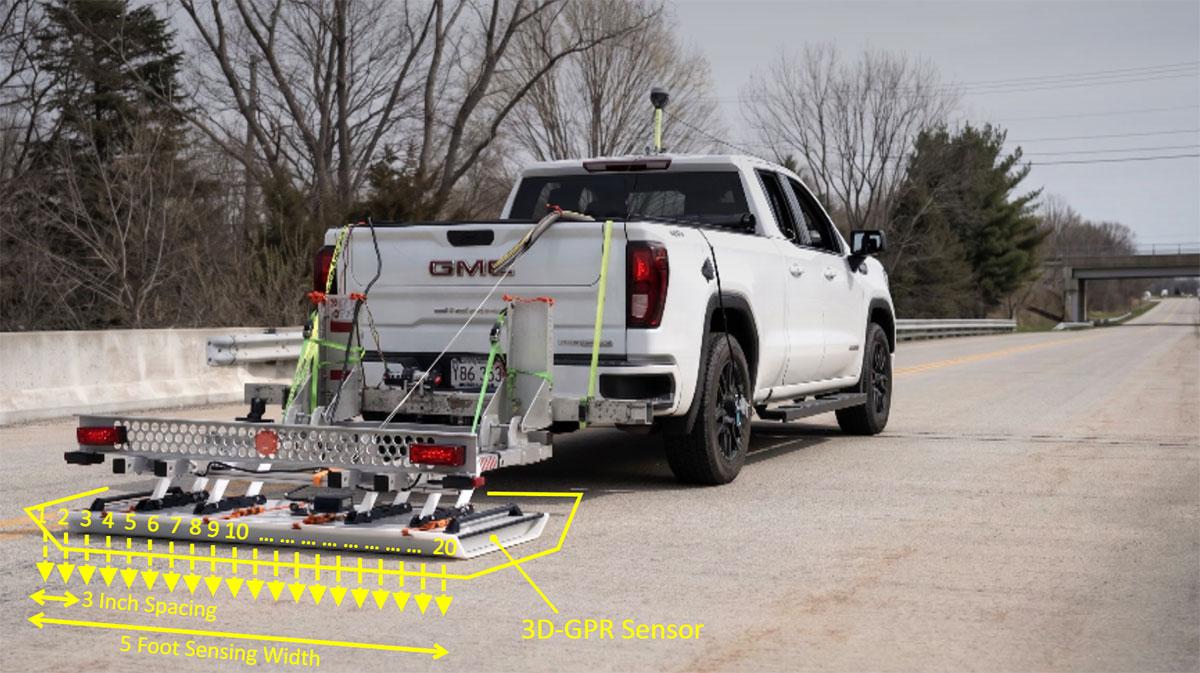
Infrasense surveyed SR-133 with a Kontur 3D-GPR sensor: a 20-channel antenna array with 3-inch spacing between channels, giving a 5-foot effective sensing width per pass. The array was towed behind a standard pickup truck, with a GPS antenna mounted high on the frame so every trace is geolocated. The result is full-width, continuous subsurface coverage at survey speed — orders of magnitude more data per pass than a single-channel GPR pulled on a survey wheel.

Equipment detail: close-up of the Kontur 20-channel 3D-GPR array on its tow behind frame, GPS antenna visible. Source: Infrasense SR-133 / TIC deck.

Data Collection

The full SR-133 corridor was scanned lane by lane — five stripes of pavement per cross-section: the westbound shoulder, westbound lane, center turning lane, eastbound lane, and eastbound shoulder. The crew worked at night to manage traffic exposure on a live state route. One pass per lane covered the entire 1.37-mile corridor; because the array senses both inline and crossline to the direction of travel, no transverse scans were needed.

Processing and Analysis

The raw data was processed and interpreted in Kontur Examiner, which plots 3D-GPR data as depth slices — horizontal sections of the subsurface at a chosen depth — and as B-scans, the vertical sections used to confirm depth and individual features. Working in Examiner, Infrasense's analysts identified and classified every dowel and tie bar at each joint, mapped the depth to the bottom of the concrete across the full surface, classified the pavement design by its signal signature, and flagged regions of high-reflection activity that indicate voids beneath the slab. Every result was exported as a georeferenced, color-coded layer and delivered on Google Earth, located against the actual street.

Deliverables

Infrasense delivered the SR-133 survey as a single georeferenced KMZ file for Google Earth, organized into five analysis layers. Each layer answers one of MassDOT's questions across the whole corridor:

Dowel Analysis

Dowel Analysis

Detect locations where dowels are present, missing, and/or misaligned.

Tie Bar Analysis

Tie Bar Analysis

Detect locations where tie bars are present, missing, and/or misaligned.

Depth Analysis

Depth Analysis

Detect the depth of concrete

Activity Analysis

Activity Analysis

Detect regions of high reflection activity (HRA) at the bottom of concrete, which can be evidence of underlying voids.

Insights from Images

Depth Slices

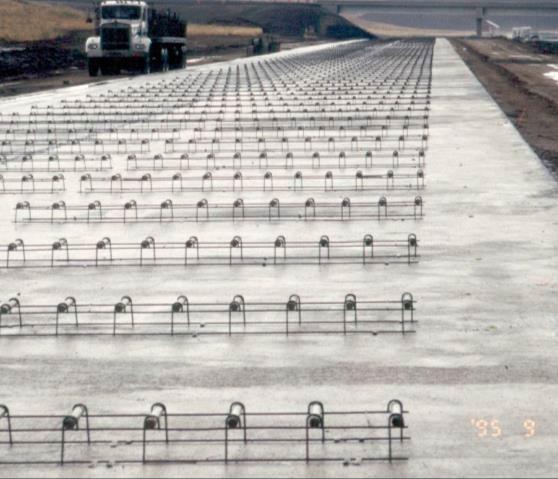
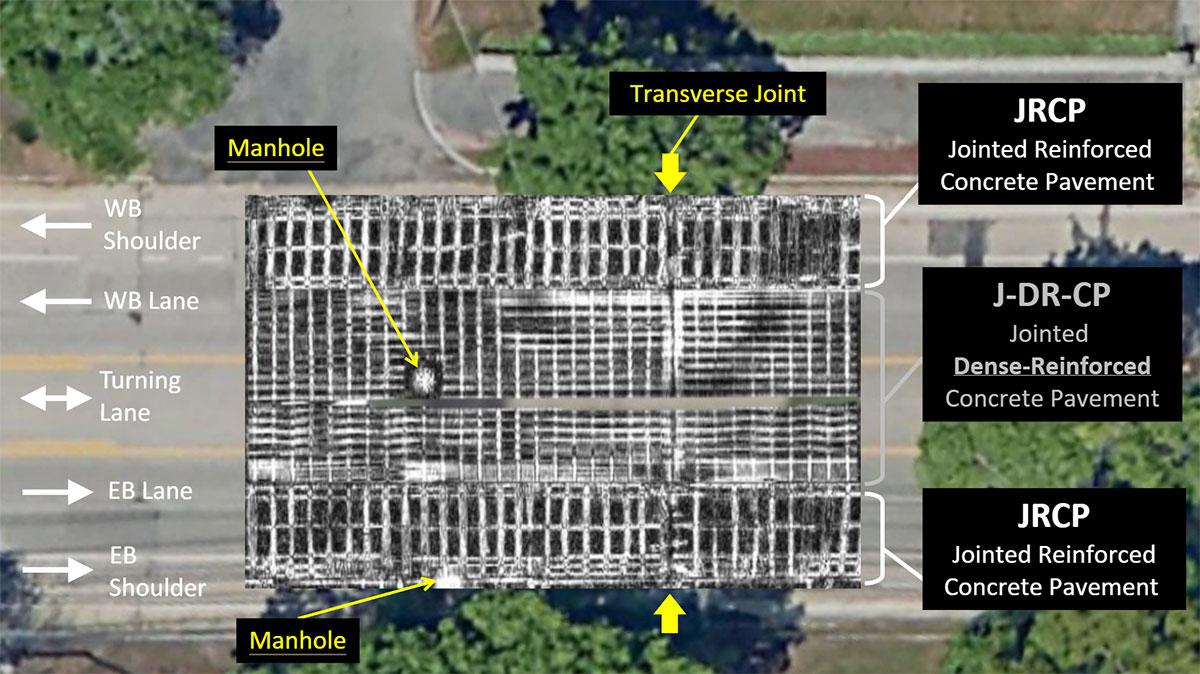
In Kontur Examiner, a depth slice is a horizontal section of the subsurface that reveals the rebar mat, dowel bars, and tie bars as distinct features. A single depth slice of SR-133 shows three different pavement designs — JPCP, JRCP, and J-DR-CP — within one cross-section of the corridor, making the patchwork visible at a glance.

JRCP / J-DR-CP / JPCP cross-section

Depth slice / cross-section: the JRCP / J-DR-CP / JPCP cross-section showing three pavement designs in adjacent lanes.

Google Earth Overlays

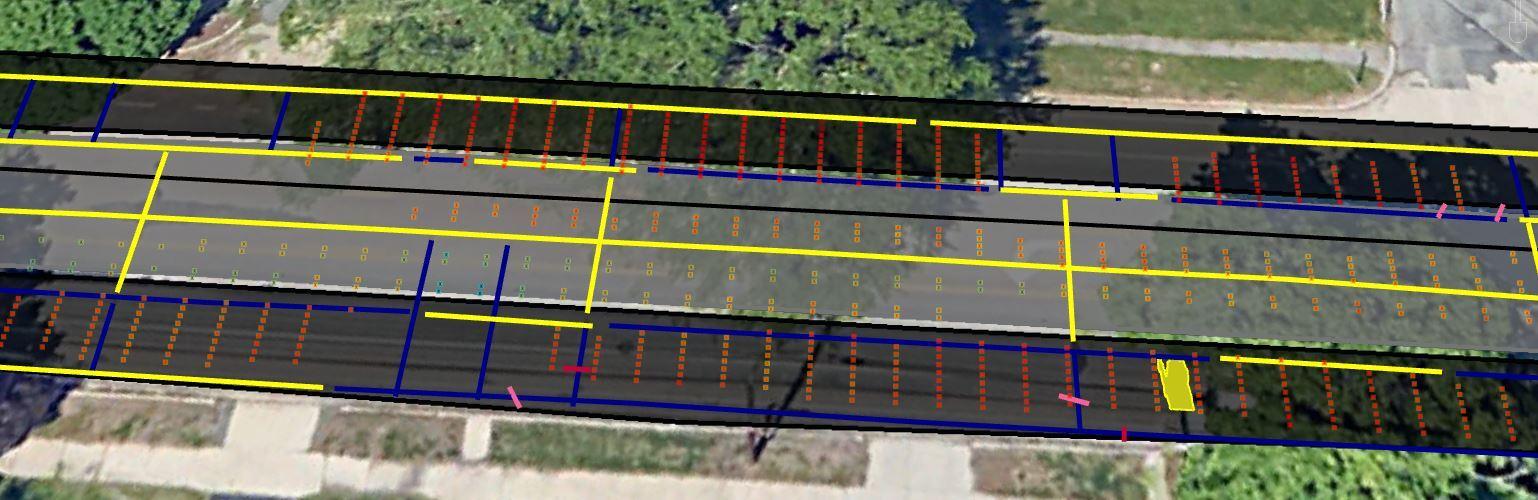
The classification results are delivered as color-coded overlays on Google Earth. Viewed across the full corridor, the dowel and tie-bar layers reveal something the example slides understate: there are extended segments where the hardware is almost entirely present (continuous blue) and other segments of comparable length where it is almost entirely missing (continuous yellow). The transition lines between those regimes are exactly where a rehabilitation specification has to change — and
they are invisible to a coring survey.

Google earth

Side-by-side comparison: two corridor segments — one where load-transfer hardware is largely Present (blue), one where it is largely Missing (yellow) — illustrating why spot coring cannot characterize the road. Source: SR-133 KMZ, isolated tie-bar layer screenshots.

Void Hot-Spots

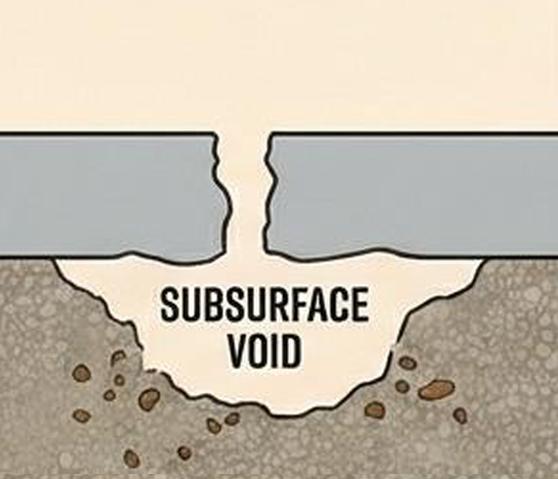
The HRA void polygons are isolated rather than continuous — consistent with discrete settlement and drainage failure points rather than systemic loss of subgrade support. In the SR-133 data they cluster near intersections and turning-lane areas, where joint stress and drainage converge. Each one is a targetable repair.

All analysis closeup

Void hot-spot: discrete HRA polygons clustered near a turning-lane intersection on Google Earth. Source: SR-133 KMZ, Activity Analysis layer screenshot.

Key Findings

The corridor sits on three different concrete designs

Cross-sections along SR-133 contain JPCP, JRCP, and J-DR-CP — sometimes in adjacent lanes of the same cross-section — and the corridor divides into three distinct construction regions. No single CPR treatment fits the whole road.

Load-transfer hardware is genuinely heterogeneous

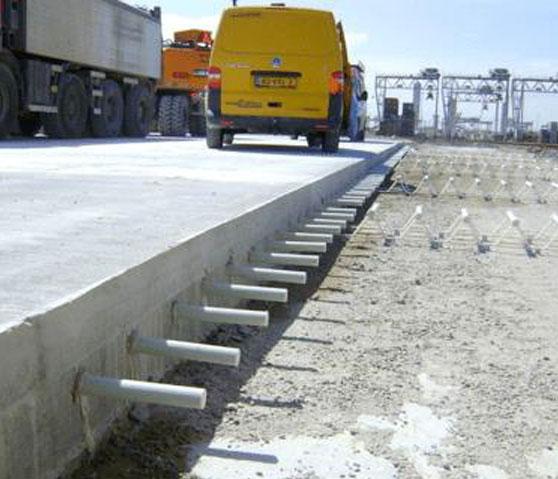
Some segments have continuous, well-placed dowels and tie bars; other segments of comparable length have hardware that is missing, set too shallow to function, or misaligned. A coring survey at typical sample spacing has a meaningful chance of characterizing the entire road by whichever segment it happened to sample.

Concrete thickness varies by more than four inches across the cross-section

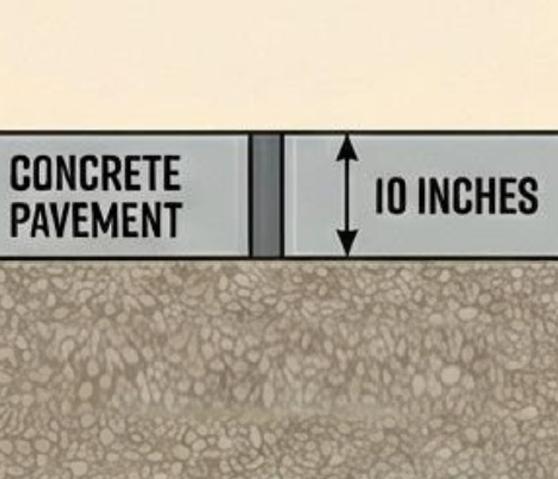
The depth-to-bottom map ranges from roughly 6.2 to 10.7 inches — sometimes between adjacent lanes — which changes the right CPR specification segment by segment.

Voids are present, locatable, and individually addressable

The activity analysis identified discrete regions of high-reflection signal at the bottom of the slab. Each was delivered as a separately-named polygon on Google Earth, ready to drop into a maintenance work-order system.

Products in use in this Project